Workshops with hands on experience; practicing real life scenario as a group
The Power on your Desktop .
Learn the tools and techniques to bring
the power of data right on your desktop.
Live Demos! .
With visual view of how the concepts can be realized using live data
and live practices by the instructor.
Thanks to the training Kata where the instructor leads and students
follow instructions step by step
AZR-10097
This course prepares you for the Microsoft Power BI Business Intelligence Introduction. In summary, Power BI enables business leaders and decision makers to have better view and visualization of data to impact and influence the decision made to impact the business.
Overivew
Data visualization, in this single series of training path, to master Power BI, with the focus on how to visualize the data and present valuable insight to the business decision maker in real time and meaningful insights to help make right decisions and have great impact of the business outcome.
Prerequisites
Knowledge
Students to this class are expected to have:
Basic knowledge of Power BI operations
Basic understanding of computer operations skills :such as managing files
Technology
Depending on the delivery method of this course, the students should have :
A Workstation with Internet browser capability such as (Chrome, Edge, or Safari)
Good persistent internet connection without blocking firewalls(ideally non corporate firewall protected workstations)
Objectives
Students who completed this course, should build the skills and knowledge that allows them to
Question the obtained data on the Power Q & A engine
Create separate data models to get more insightful data with Power Pivot.
Data Visualization with Power BI
Audience
This course is designed to assist and equip the students with the skills and knowledge that allows them to perfect their daily tasks with respect to data analysis and visualization using Microsoft Power BI.
Business Analyst: Understand the tools and techniques required to maximize the use of data using Power BI.
Business Executive: To exploit the potentials of Power BI in the decision making process.
Marketing Analyst: To understand how to utilize Power BI in setting directions and goals for marketing strategies
Timeline
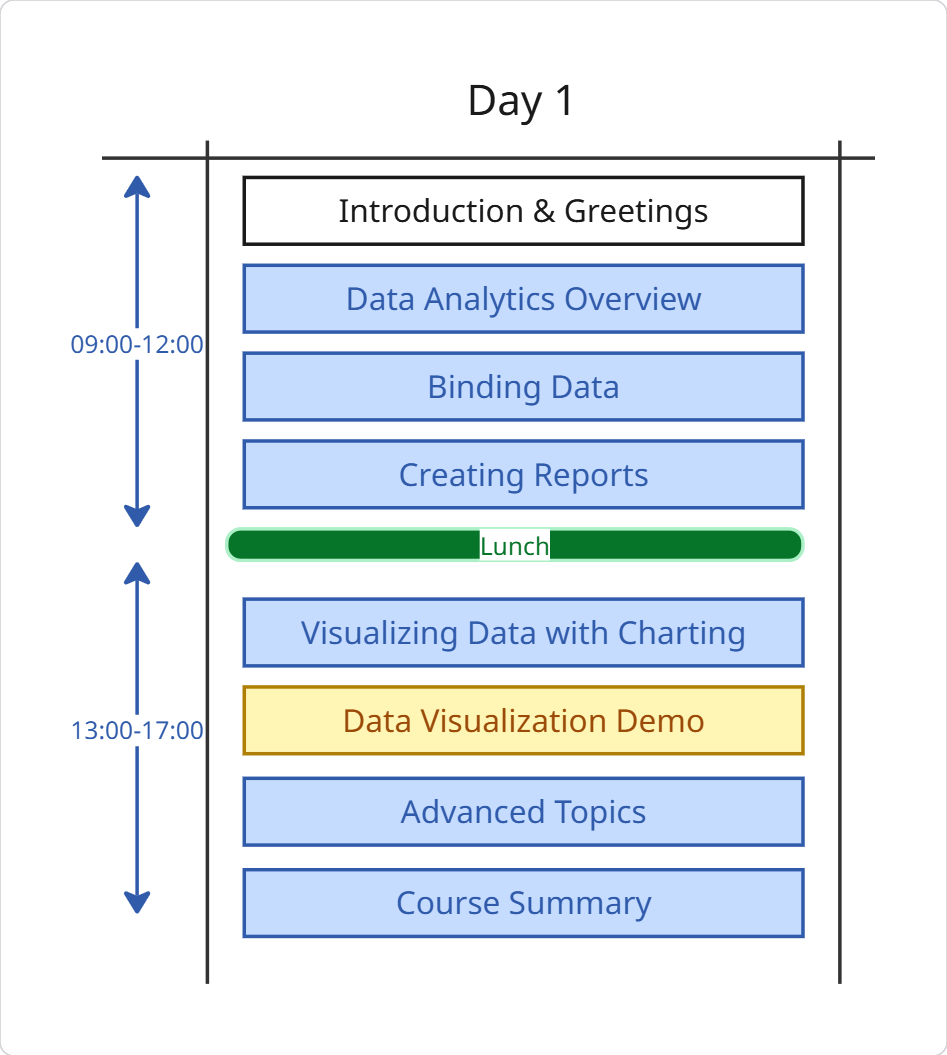
The Power BI Intermediate Course is a 1 day course, includes lectures, demos.
The following is guidelines for the instructor to organize the time pace with the students, subject to change based on students preference.
Breaks during the day follows the 106 rule, every 45-60m
*the 106 rule, indicates the human memory capacity to learn the new factual elements which is 106 facts before the memory could be reused.
Click to order In Class Delivery
Click to order Virtual Class Delivery
Click to order Instructor only Delivery
Course Curriculum
Module 1: Overview of Data Analytics
Importance of Data
Data Sources
Data Visualizations
Analytics vs. insights
Module 2: Binding Data
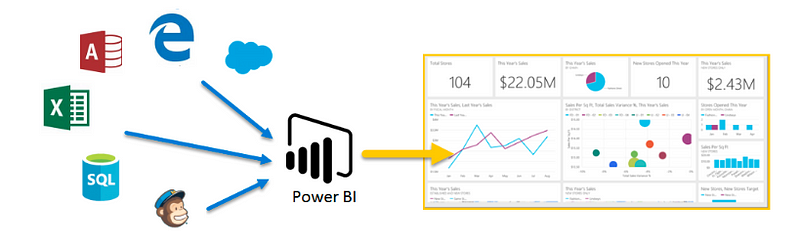
Power BI Data Sources
Calculated DAX functions
Binding and Binding Data
Module 3: Power BI Reports
Identify Query
Design data sets
Simple Reports
Multipage Reports
Create Power BI Reports
Update Power BI Reports
Export Power BI Reports
Integrate Reporting with external applications
Module 4: Visualizing and Charts
Types of charts
Linear vs. complex charting
Comparable charts
Using Open Telemetry
Module 5: Advanced Topics
Overview of Objects and Actions in Power BI
Inserting Objects
Bookmark Actions
Drill through Action in Power BI
Course Summary
Calendar
Scroll through the months, and chose the right schedule for you, send us a standard request form register


